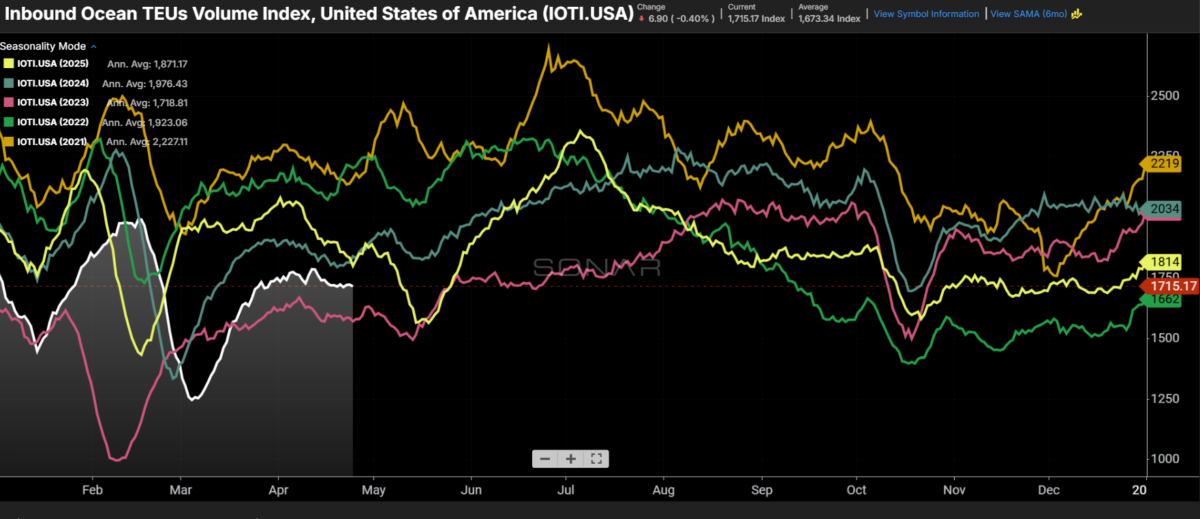
Chart of the Week: Inbound Ocean TEUs Volume Index – USA SONAR: IOTI.USA Seasonality view
So far, import demand has been a relative non-factor in the recent domestic freight market upheaval, unlike the previous cyclical tightening during the pandemic. That is not to say things won’t change, but let’s take a deeper look at how import demand has influenced surface transportation markets in recent years and consider how that applies to the rest of 2026.
The Inbound Ocean TEUs Volume Index (IOTI) is a 14-day moving average that measures the volume of requests to move twenty-foot containers to the U.S. via ocean. It hit an all-time peak of 2,692 in June 2021. Its current value of 1,715 is well below that figure — closer to multi-year lows for this time of year than highs — but that does not necessarily mean demand is unhealthy.
In 2024 and 2025, shippers were concerned about service disruptions and tariffs, leading them to order well ahead of expected fulfillment in what many supply chain professionals call a just-in-case ordering strategy.

Using the inventory level component of the Logistics Managers’ Index, which measures whether companies are growing or reducing inventory, there have been two periods of strong inventory building since 2019. In early 2022, inventory levels grew at a record pace as demand waned and shipping networks became less congested, leading to a significant drawdown in late 2022 and early 2023.
In 2024, shippers began to restock as conflict in the Middle East threatened maritime capacity and service. As that concern faded in early 2025, tariffs became an increasing worry, driving erratic ordering and inventory growth.
As tariff concerns settled in late 2025, orders fell back into a more traditional pattern and now align almost perfectly with inventory levels — a leaner model that closely resembles just-in-time practices.
Leaner warehouses associated with just-in-time practices keep inventory costs low but are less capable of absorbing demand shocks and require more consistent transportation service. This is happening just as the trucking market is emerging from one of its softest and longest downturns in years, leaving it ill-equipped to flex in response to any upswing in demand.

The SONAR Truckload Volume Index (STVI) measures electronic requests — or tenders — from shippers to carriers for truckload capacity. The STVI has reached its current level several times over the past few years, but rejection rates were far lower then. This is because capacity has been quietly bleeding out of the market for three years, a trend that added regulatory enforcement pressure appears to have accelerated.
The peak season for imports typically runs from July through August, with much of the transcontinental freight moving via intermodal. If inventory levels run too thin, intermodal loses its interchangeability with trucking as transit times lengthen.
This market has tightened without any assistance from import demand or volatility to this point — and it is fair to say that influence will only grow as the year progresses.
About the Chart of the Week
The FreightWaves Chart of the Week is a chart selection from SONAR that provides an interesting data point to describe the state of the freight markets. A chart is chosen from thousands of potential charts on SONAR to help participants visualize the freight market in real time. Each week a Market Expert will post a chart, along with commentary, live on the front page. After that, the Chart of the Week will be archived on FreightWaves.com for future reference.
SONAR aggregates data from hundreds of sources, presenting the data in charts and maps and providing commentary on what freight market experts want to know about the industry in real time.
The post Imports sitting out the freight market flip appeared first on FreightWaves.