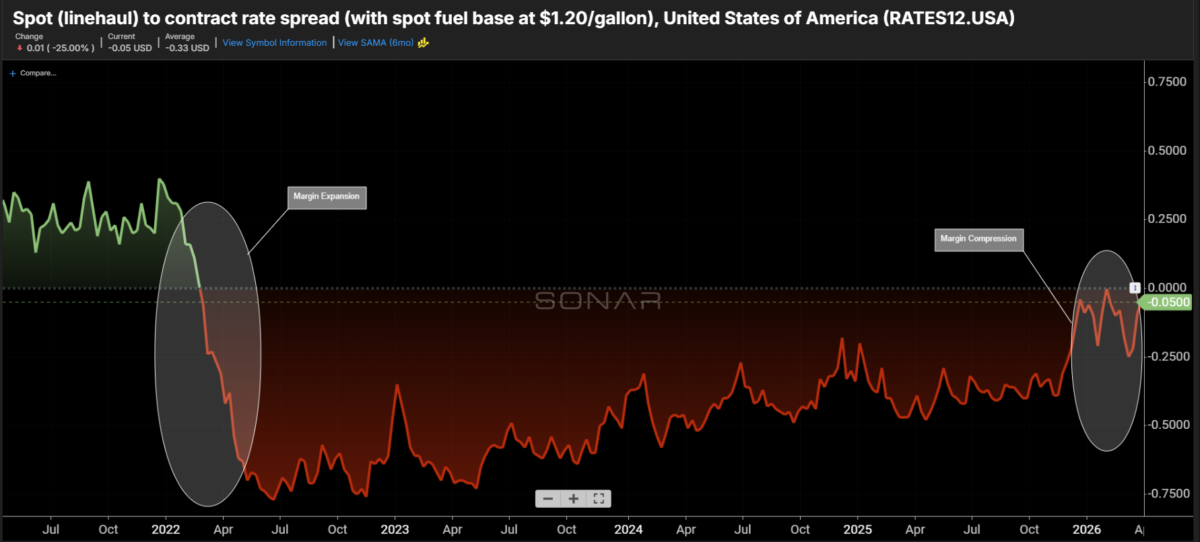
Chart of the Week: Spot to contract rate spread (excluding estimated spot fuel costs above $1.20/gal) SONAR: RATES12.USA
The spread between spot and contract rates suggests that the past few months may have been among the most challenging periods for non-asset-based logistics companies to navigate in recent history. The rapid shift in market conditions following long periods of stability can be the hardest to weather from a procurement standpoint — though that doesn’t mean it is all doom and gloom for 3PLs.
Freight brokerages are the quintessential middlemen of the freight market. They act as transportation management departments for many businesses throughout the U.S., while also bridging the gap between shippers and an extremely fragmented and opaque carrier environment on the transactional side. These two functions ebb and flow in importance with the market, with transactional — or spot market — functions becoming more prevalent during periods of tightening.
During periods of relative stability, when spot rates are low and stable relative to contract — as was the case for the three years prior to the recent market shift — 3PLs deliver value by managing shipper transportation networks and negotiating on their behalf with carriers. This function is widely known as managed transportation.
While a shipper may see a single rate for a lane over a 12-month cycle, the 3PL can leverage its expansive carrier network to find the best fit and cost. These rates tend to align more closely with spot rates because they draw from a much larger pool of carrier options, particularly smaller fleets with lower overhead.
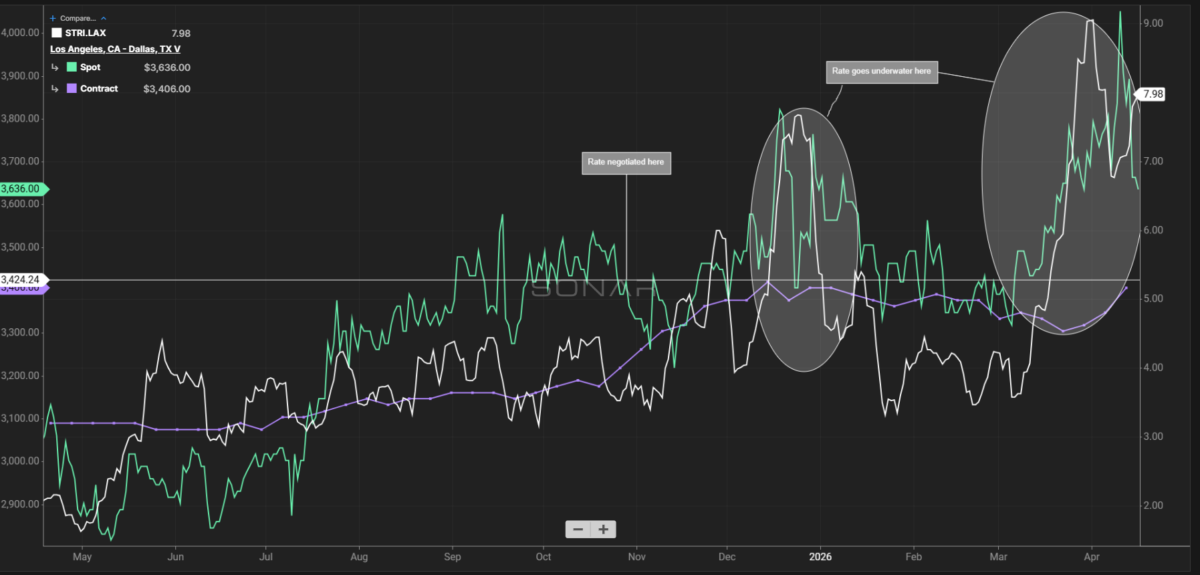
This model’s weakness is exposed when the market turns volatile or spot rates expand rapidly. Carriers who were getting $2.30 per mile suddenly receive multiple calls to run the same lane at $2.70. In that scenario, there is little chance of covering the lane with a carrier who has no prior relationship or familiarity with it.
Brokers often have to scramble, and many end up covering loads at a loss — particularly when they are caught off guard by shifting market conditions. A rapid change like the one seen in recent months is the hardest to manage given the short window for discovery and adaptation.
There is a bright side, however. As the market tightens, asset carrier networks become strained, leading them to reject customer loads in the form of tender rejections. Many of those rejected loads flow to the spot market, where brokers can find carriers to cover them at rates not previously locked in. This tends to drive higher revenues, though not necessarily higher margins in the near term.
As the market adjusts and contract rates reset to higher levels, it becomes easier for brokers to operate profitably without relying as heavily on transactional opportunities. If the market loosens rapidly — as it did in 2022 — that is typically when brokers see their best profitability, though the longer-term outlook becomes less appealing as the need for their services diminishes alongside stabilizing capacity and falling rates.
This dynamic is visible in JB Hunt’s recent earnings from their ICS/brokerage division: revenues were up 20% year-over-year, but margins fell 330 bps. This should not be read as a long-term signal of distress, but rather as a normal result of a tightening market. Brokers reporting flat margins in Q1 2026 are the overachievers. As contracts get renegotiated, margins should recover in this environment.
It is a continuous balancing act for the 3PL — near-term underperformance can actually signal longer-term success, and vice versa.
About the Chart of the Week
The FreightWaves Chart of the Week is a chart selection from SONAR that provides an interesting data point to describe the state of the freight markets. A chart is chosen from thousands of potential charts on SONAR to help participants visualize the freight market in real time. Each week a Market Expert will post a chart, along with commentary, live on the front page. After that, the Chart of the Week will be archived on FreightWaves.com for future reference.
SONAR aggregates data from hundreds of sources, presenting the data in charts and maps and providing commentary on what freight market experts want to know about the industry in real time.
The post Spot to contract rate spread contraction tests 3PLs appeared first on FreightWaves.