A positive inflection in freight shipments now appears likely after 40 months of year-over-year declines, according to a monthly report from Cass Information Systems. The turn in demand would further bolster the supply-driven rate recovery that began late last year.
The multimodal shipments component of the Cass Freight Index dipped just 1.2% year over year in May, the smallest decline in 18 months. Shipments were up 3% from April but down 0.3% on a seasonally adjusted basis.
An increase in domestic intermodal volumes and “many spot indicators suggest improving freight demand” drove the change.
“These are positive signs that a volume recovery in the second half of the year remains likely,” the Monday report said. “While it may not be a consumer-led recovery, inventories are tight, tariffs are falling, and the U.S. dollar is soft, all of which support demand growth.”
A 5.2% volume decline on a two-year-stacked comparison was the smallest since February 2024.
Assuming historical seasonal volume trends occur throughout the remainder of the year, the index is projected to log a 1.8% y/y increase in the back half.
| May 2026 | y/y | 2-year | m/m | m/m (SA) |
| Shipments | -1.2% | -5.2% | 3.0% | -0.3% |
| Expenditures | 7.5% | 8.3% | 5.3% | 4.9% |
| TL Linehaul Index | 6.9% | 7.5% | 0.4% | NM |
Cass’ expenditures index, which measures total freight spend including fuel, jumped 7.5% y/y and was up 5.3% from April (4.9% higher seasonally adjusted). The y/y increase was the biggest since late 2022. A smaller decline in shipments, elevated fuel prices and higher freight rates were the catalysts for the increase.
Cass’ TL linehaul index, which tracks rates excluding fuel and accessorial surcharges, increased 6.9% y/y, the largest increase in nearly four years. The dataset, which includes for-hire spot and contract rates, has been up y/y in 17 consecutive months.
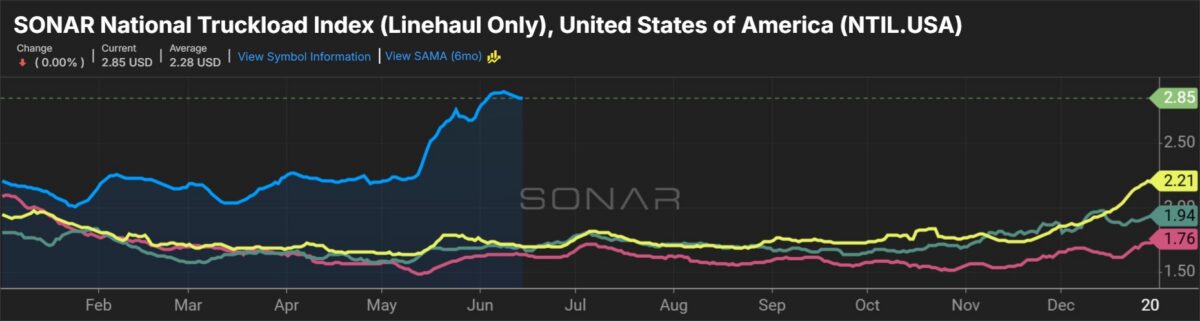
“Volumes are beginning to recover, but it is mainly supply constraints supporting higher rates, in our view, both for equipment capacity and drivers,” the report said.
Truckload capacity began to exit last year as authorities tightened enforcement of non-domiciled CDL and English proficiency rules, alongside crackdowns on questionable driver schools and ELD providers. Recent events (increased policing of cabotage rules and the Supreme Court’s broker liability ruling) are further pushing noncompliant drivers from the industry.
Contract rates set earlier this year are proving too low as capacity continues to dwindle, according to publicly traded carriers appearing at an investor conference last week. The group sees the potential for double-digit rate hikes this year and next as routing guides crumble. That would be quite the turnaround after a nearly four-year downturn.
Data used in the indexes comes from freight bills paid by Cass (NASDAQ: CASS), a provider of payment management solutions. Cass processes $37 billion in freight payables annually on behalf of customers.
More FreightWaves articles by Todd Maiden:
- Routing guides are crumbling: ‘It is different this time’
- Truckload carriers eyeing multiyear rate upcycle
- Analysts say Amazon won’t shake LTL market—yet
The post Cass report: Freight volume recovery set for second half appeared first on FreightWaves.